Orientation
South · East · West
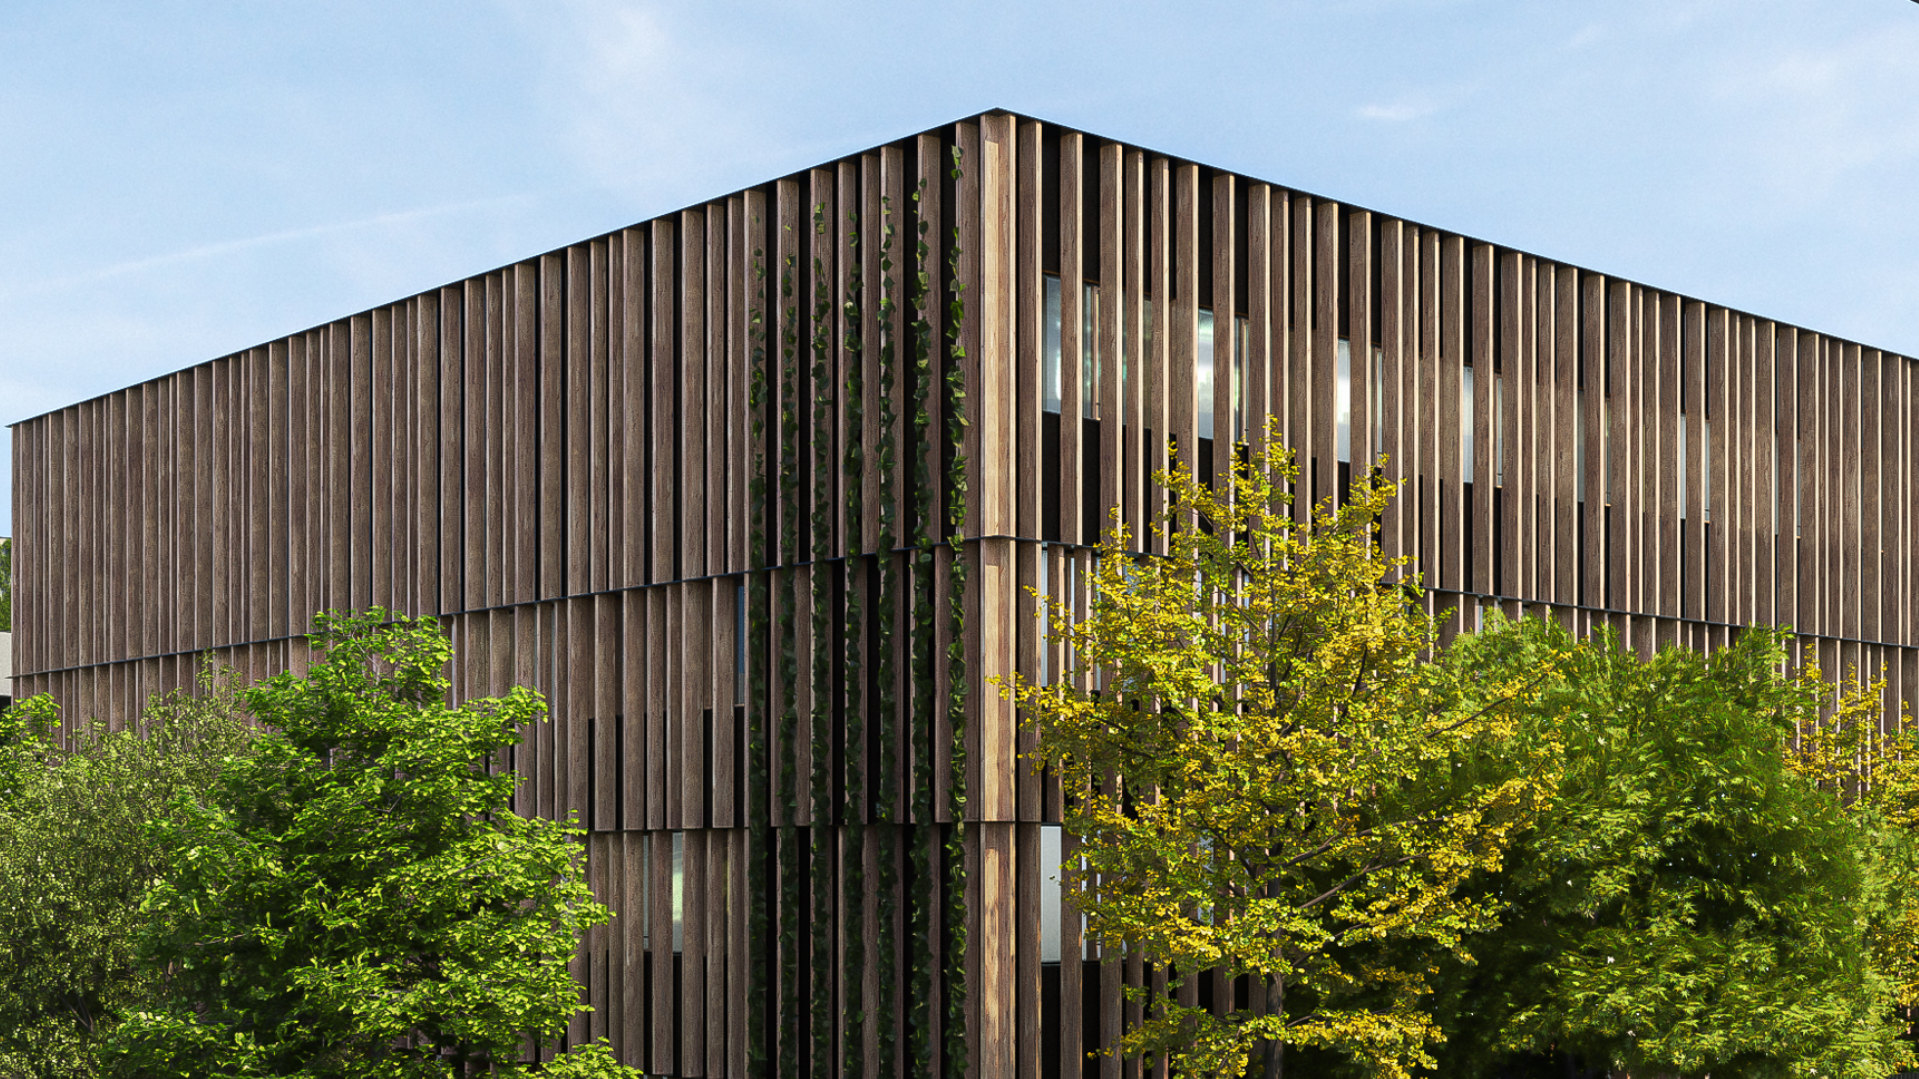
KTI · Daylight–Energy Performance Analytics
A Grasshopper shoebox model and ClimateStudio simulations compare seven window designs, three orientations and several external-louvre settings.
01 · Project setup
This one-week study used a modular 37 × 14 m office building and repeated 3.7 × 5.4 m rooms as a consistent simulation model. Its purpose was to help design teams identify a strong pool of facade options using predetermined variables agreed through workshops: orientation, window design and louvre geometry. Each run connected those inputs to total load, cooling load and useful daylight illuminance at desk level.
02 · Parameters
Orientation, window design and three louvre settings define each configuration. The depth-zero cases retain one canonical gaps and rotation setting to avoid repeating identical no-louvre simulations.
South · East · West
5 · 6 · 7
−40° · −20° · 0° · 20° · 40°
0 · 20 · 40
Design 0 to design 6
03 · Results
Use the first row of controls to define a set and the second row to create a direct comparison. Select a point to load its exact facade image and input settings, or isolate the five ranked options for each orientation.
Loading the results explorer…
Selected configuration
Input settings and output values will appear here.
04 · Reading the dataset
The ranking identifies five options per orientation after applying a minimum UDI requirement of 55%, weighting lower cooling load at 70% and higher UDI at 30%. Fixed graph limits keep filtered groups comparable with the complete dataset, while the paired filters show how individual design decisions change performance.